


Written by Cal Skinner
Lakewood resident Steve Willson did the following analysis:
Hate Crimes Up — and Down
The FBI just released their annual report on hate crimes in the U.S. It’s useful to look at the data in more than one way to gain perspective.
First, how serious an issue is “hate crime”?
Well, in 2017, there were 1.2 million violent crimes reported to the FBI and 7.7 million property crimes.
Of these incidents, a little over 7,000 were classified as hate crimes.
Hate crimes constituted 0.04% of all crimes against property and 0.33% of all violent crimes.
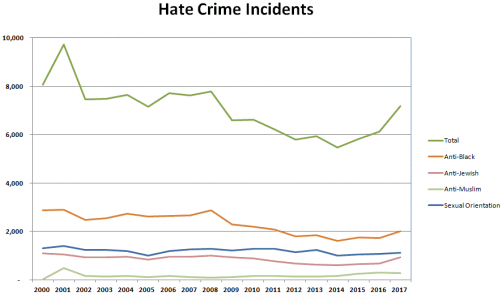
Second, what is the trend in hate crimes?
The good news is that hate crimes are far lower than at their historical peaks. The bad news is the last few years have seen a large increase.
FBI statistics go back to 1996. Since then, incidents of hate crimes against blacks have fallen by 45%.
Undoubtedly the fall from earlier periods, before the FBI began tracking such statistics, is much greater.
However, in the three years since 2014, the number of incidents of hate crimes against blacks has increased 24%.
Hate crimes against Jews is down 15% from the peak recorded in 2000 but is up 54% since 2014.
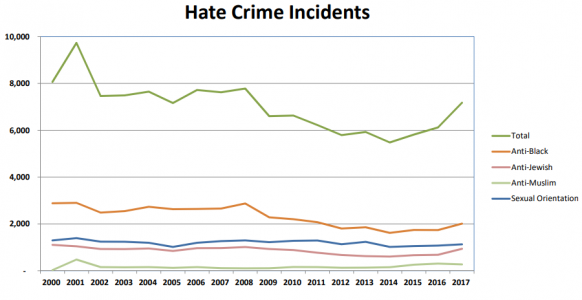
 Hate crimes against Muslims jumped in after 9/11, jumping from 28 incidents in 2000 to 481 incidents in 2001.
Fortunately, after that, the number of incidents fell sharply, to 155 the next year. From the peak, incidents involving Muslims has fallen 43%.
However, the increase since 2014 is 77%.
Hate crimes based on sexual orientation peaked in 2001 and has fallen 19% since then.
The increase since 2014 is 11%.
Third, how is hate crime distributed?
Hate crimes against
- blacks constitute about 28% of all incident
- sexual orientation 16%
- Jewish 13% and
- Muslim 4%
This article was originally published at McHenry County Blog.